In my opinion, one of the strongest traits that an incident responder can have is the ability to think in terms of graphs. All-too-often IR attempts to build lists (machine names, users, indicators). This seems logical, in order to find the full scope of an incident, you need to find all affected devices. But the problem is that only helps you remember what you've already found. As an incident responder, you want to try to understand where the attacker is going and how they got there in order to know what you're looking for.
Graphing Database
One way to assist with attack graphing is to use a graphing database. I personally like Neo4j because it's free to use, has a decent Python library, and is easy to use the visualizations. Because I have experience with Neo4j, that's what I will be using in this blog but you can easily port this to other databases.
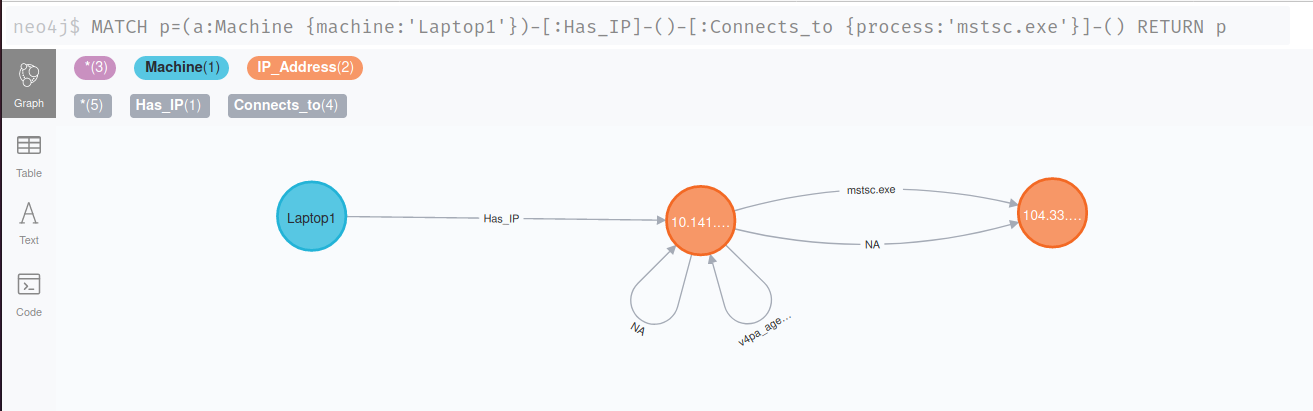
Let me start by explaining one example I've used for incident investigations. The data I used was acquired using an EDR solution, parsed with Python, and placed into a Neo4j database. This device was identified because it was calling out to a known malicious IP Address (104.33.x.x). In the screenshot below, I map a machine name (Laptop1) to it's IP Address. I then review all processes that make network connections and link the source and destination IP addresses using the corresponding process:
Okay cool, how does this help?
Each device on a network can make hundreds or thousands of legitimate, non-malicious network connections each hour. This can make it incredibly difficult to determine what is legitimate and what is malicious. The image below shows 2 infected devices and allows me to easily see connections that both infected devices share:
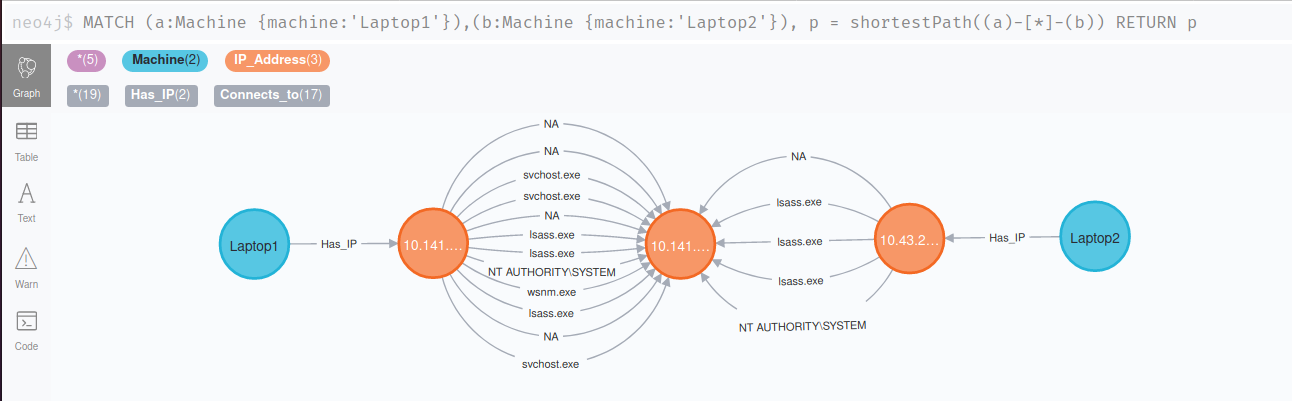
This can allow an investigator to potentially find devices that are being used as proxies by an attacker. This is a simple example of showing processes making network connections but this can easily be ported to show system events, relationships between victims, or any combination. The nice thing about Neo4j is that, at the end, you export all indicators, devices, or users into a nice list if you want.